Redesigning Event Match Quality (EMQ) in Meta Ads Manager
Usability Testing · Analytics · Surveys
Framing the Challenge & Aligning Teams
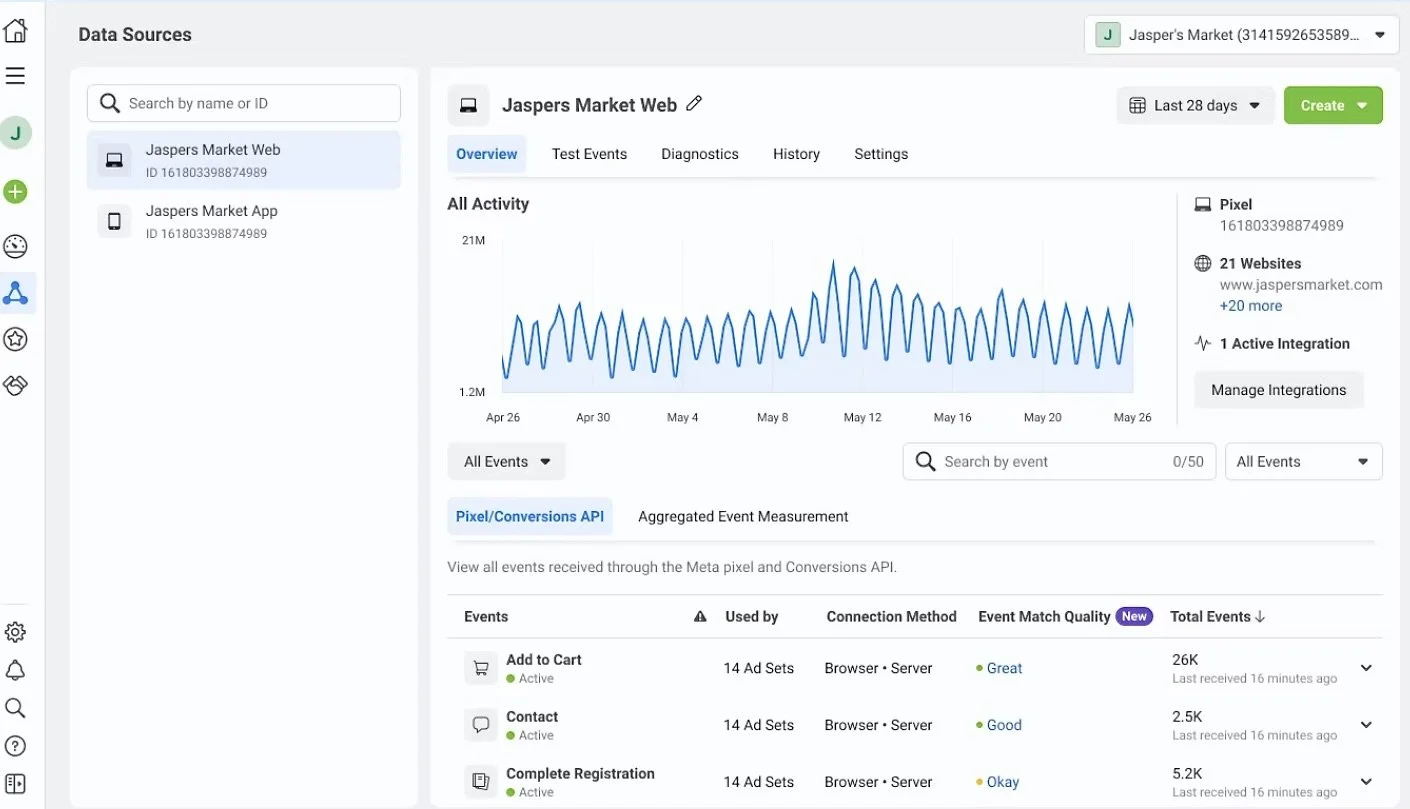
Event Match Quality (EMQ) is a rating system within Meta Ads that shows how well an advertiser’s customer data aligns with Meta’s user profiles. A high score should mean better targeting, reduced CPA, and stronger ROI.
But advertisers weren’t using it. They struggled to find it, didn’t understand what it meant, and weren’t convinced it would improve their ROI. For advertisers, this meant wasted spend and frustration. For Meta, it meant churn risk and an underutilized feature with high business value.
My role was to get everyone on the same page, I led a research kick-off workshop with a product designer, product manager, and content strategist. We clarified objectives, aligned on scope and timelines, and defined success criteria—anchoring the study in both user and business needs.
Finding the Right Advertisers to Learn From
With support from a data analyst, we recruited a diverse set of advertisers to ensure our findings represented different industries, geographies, and ad budgets.
Participants (N=9):
Age: 26–65 (4 men, 5 women)
Regions: 6 North America, 2 EMEA, 1 APAC
Industries: 4 eCommerce, 2 Finance, 2 Gaming, 1 Marketing Agency
Profiles: Both setup completers and those who abandoned mid-setup
This mix gave us voices from sophisticated campaign managers and resource-limited teams alike.
Running Usability Tests in Event Manager
I designed the study to capture both behavioral data (what participants did in the product) and attitudinal data (what they thought and felt).
Conducted remote moderated usability tests with a think-aloud protocol.
Core tasks: locate EMQ, interpret its meaning, decide whether to act on it.
Each session lasted 45–60 minutes and was recorded.
Supporting tools strengthened the findings:
Analytics → tracked clicks, hovers, and setup completions.
Heatmaps (Hotjar) → visualized attention and interaction patterns.
Surveys → measured comprehension, confidence, and ease of setup before/after design updates.
This mixed-methods approach gave us both depth and validation.
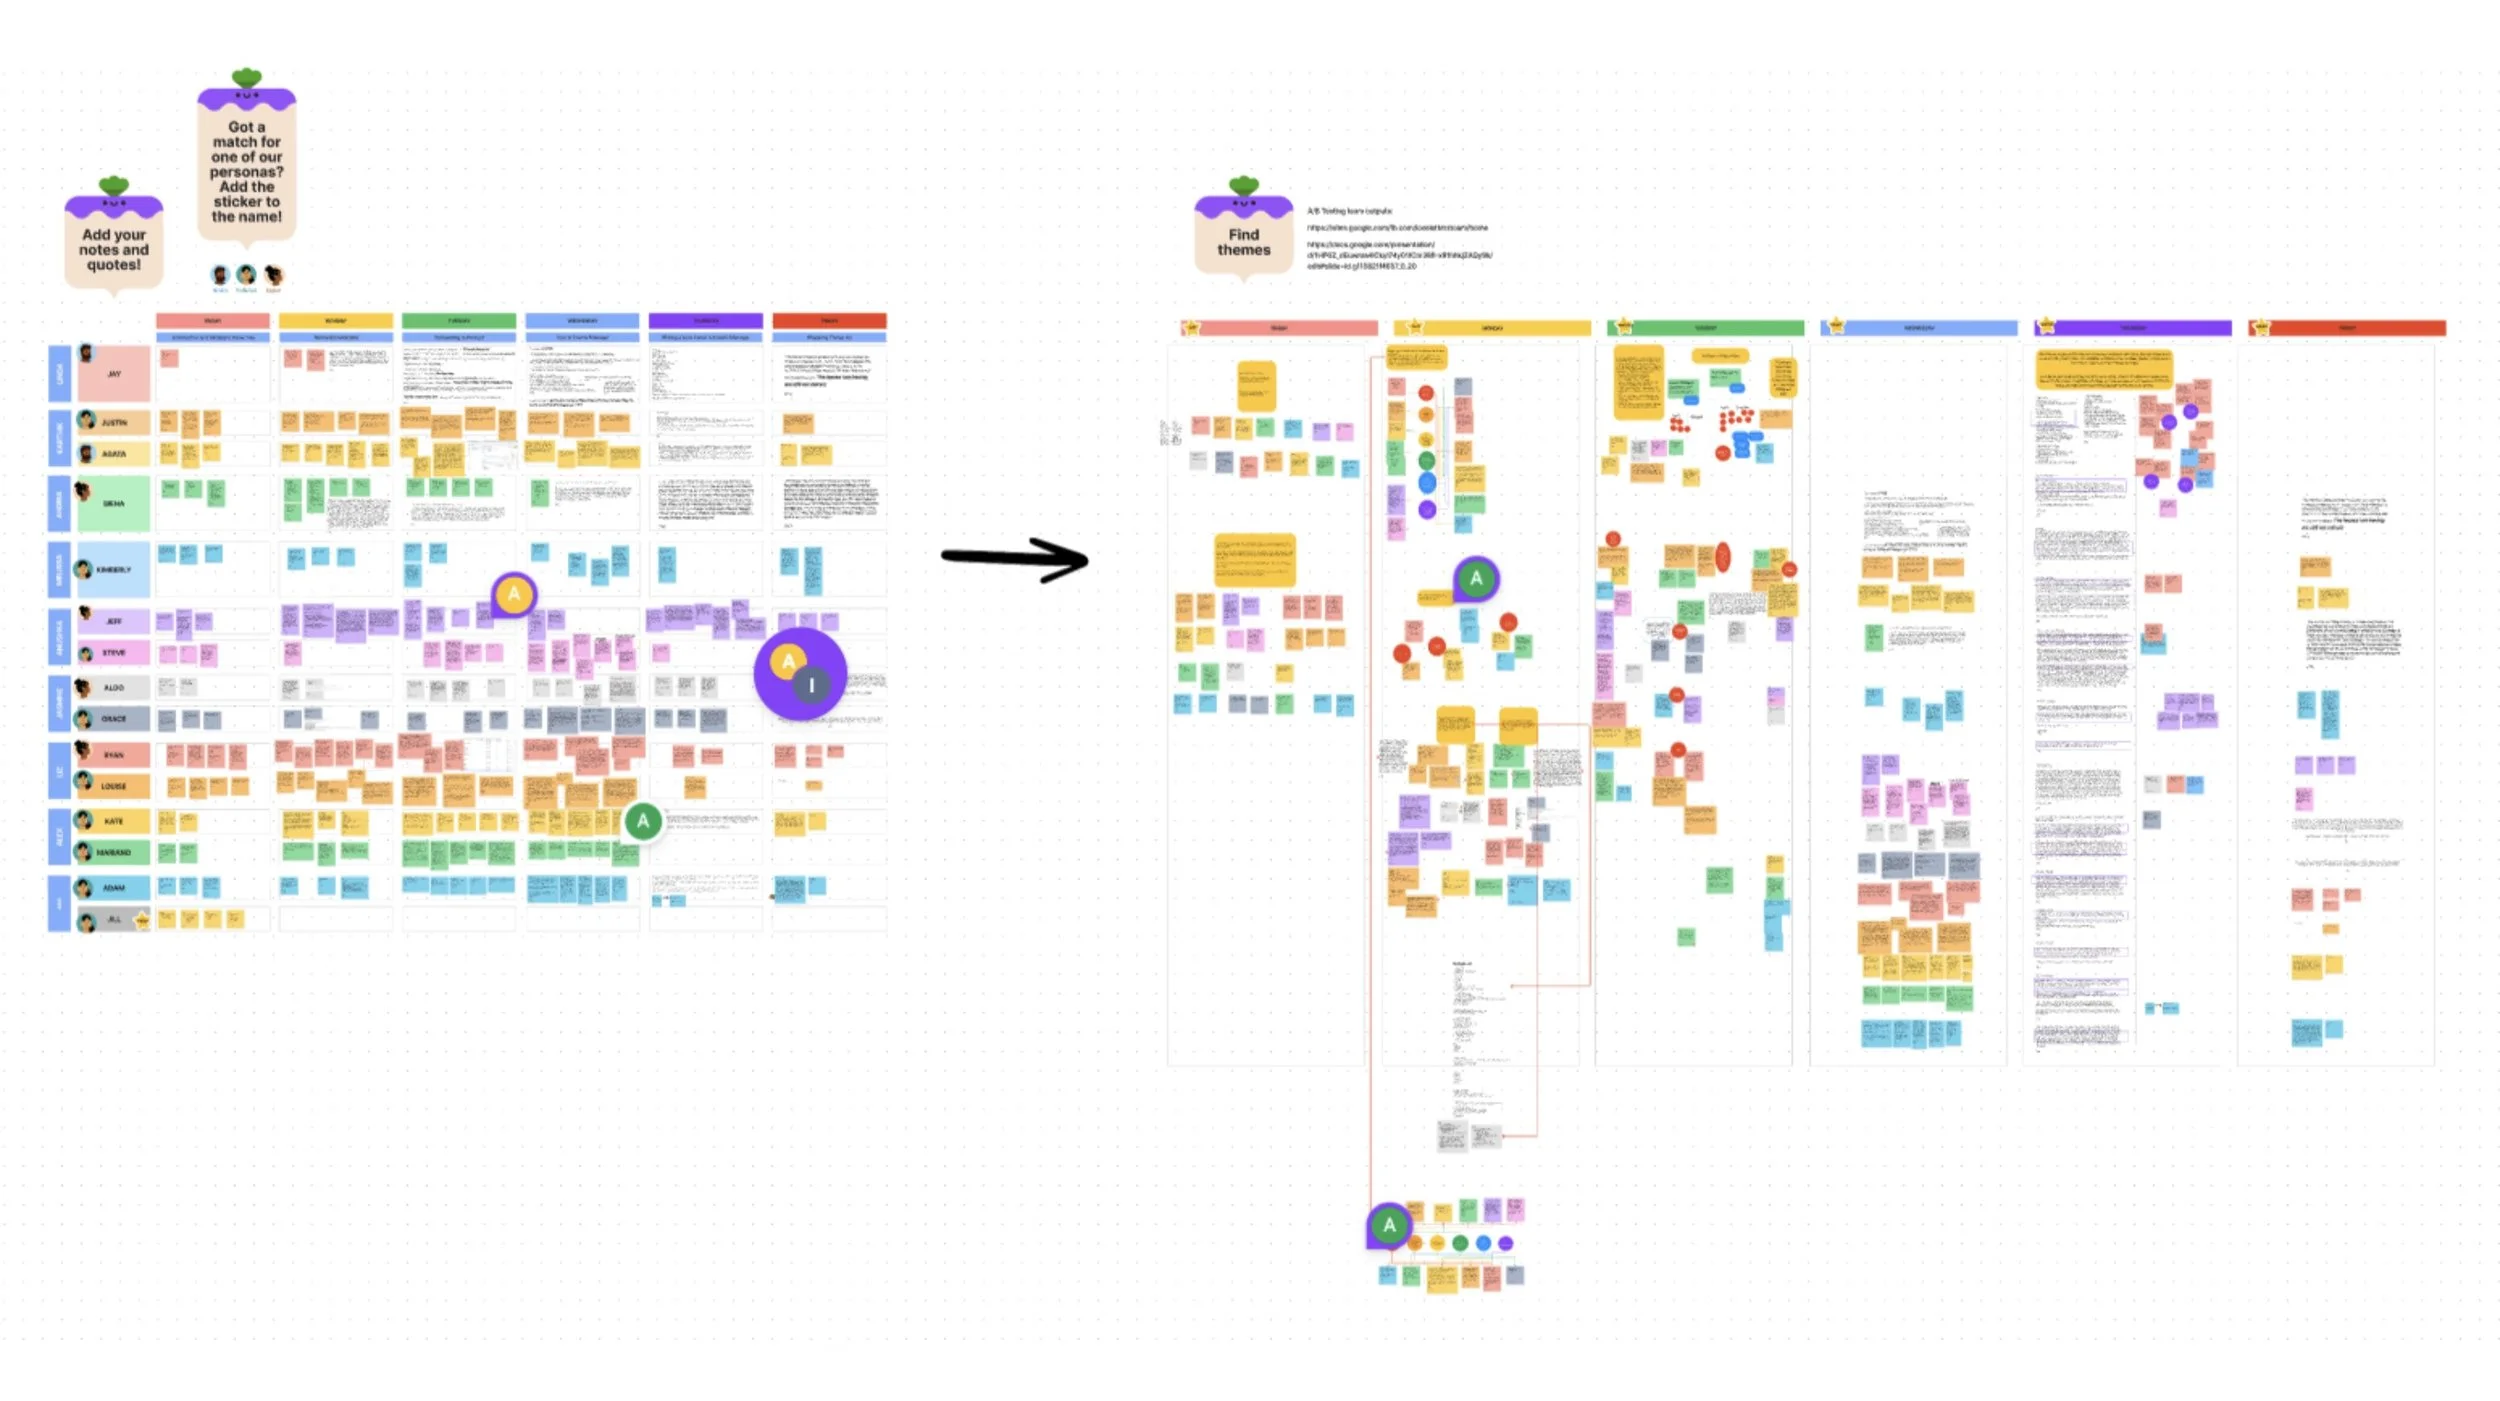
Making Sense of What We Saw and Heard
After each session, I reviewed notes and recordings, coding observations into themes. Through thematic analysis, three consistent pain points emerged
Insights & Takeaways
Visibility
6/9 participants didn’t notice EMQ unless prompted. It was lost in cluttered notifications.
“Purchase events are my main metric. I couldn’t even find the score in all the noise.”
Comprehension
5/9 participants didn’t understand the 1–10 numeric score. They wanted diagnostic details and next steps.
“4.6/10 doesn’t tell me what to do. I need to know what’s causing it and how to fix it.”
Value Proposition
5/9 participants doubted whether improving EMQ would change ROI.
“I wouldn’t take action unless I knew it really improved my campaigns.”
Turning Pain Points into Opportunities
Findings alone weren’t enough—we needed to reframe them into opportunities. I synthesized the insights into “How Might We” questions:
How might we make EMQ impossible to miss during setup?
How might we make a score like 4.6/10 meaningful and actionable?
How might we show advertisers the ROI payoff of improving EMQ?
These reframes gave our cross-functional team a shared language for brainstorming and guided us toward solutions that addressed real user needs.
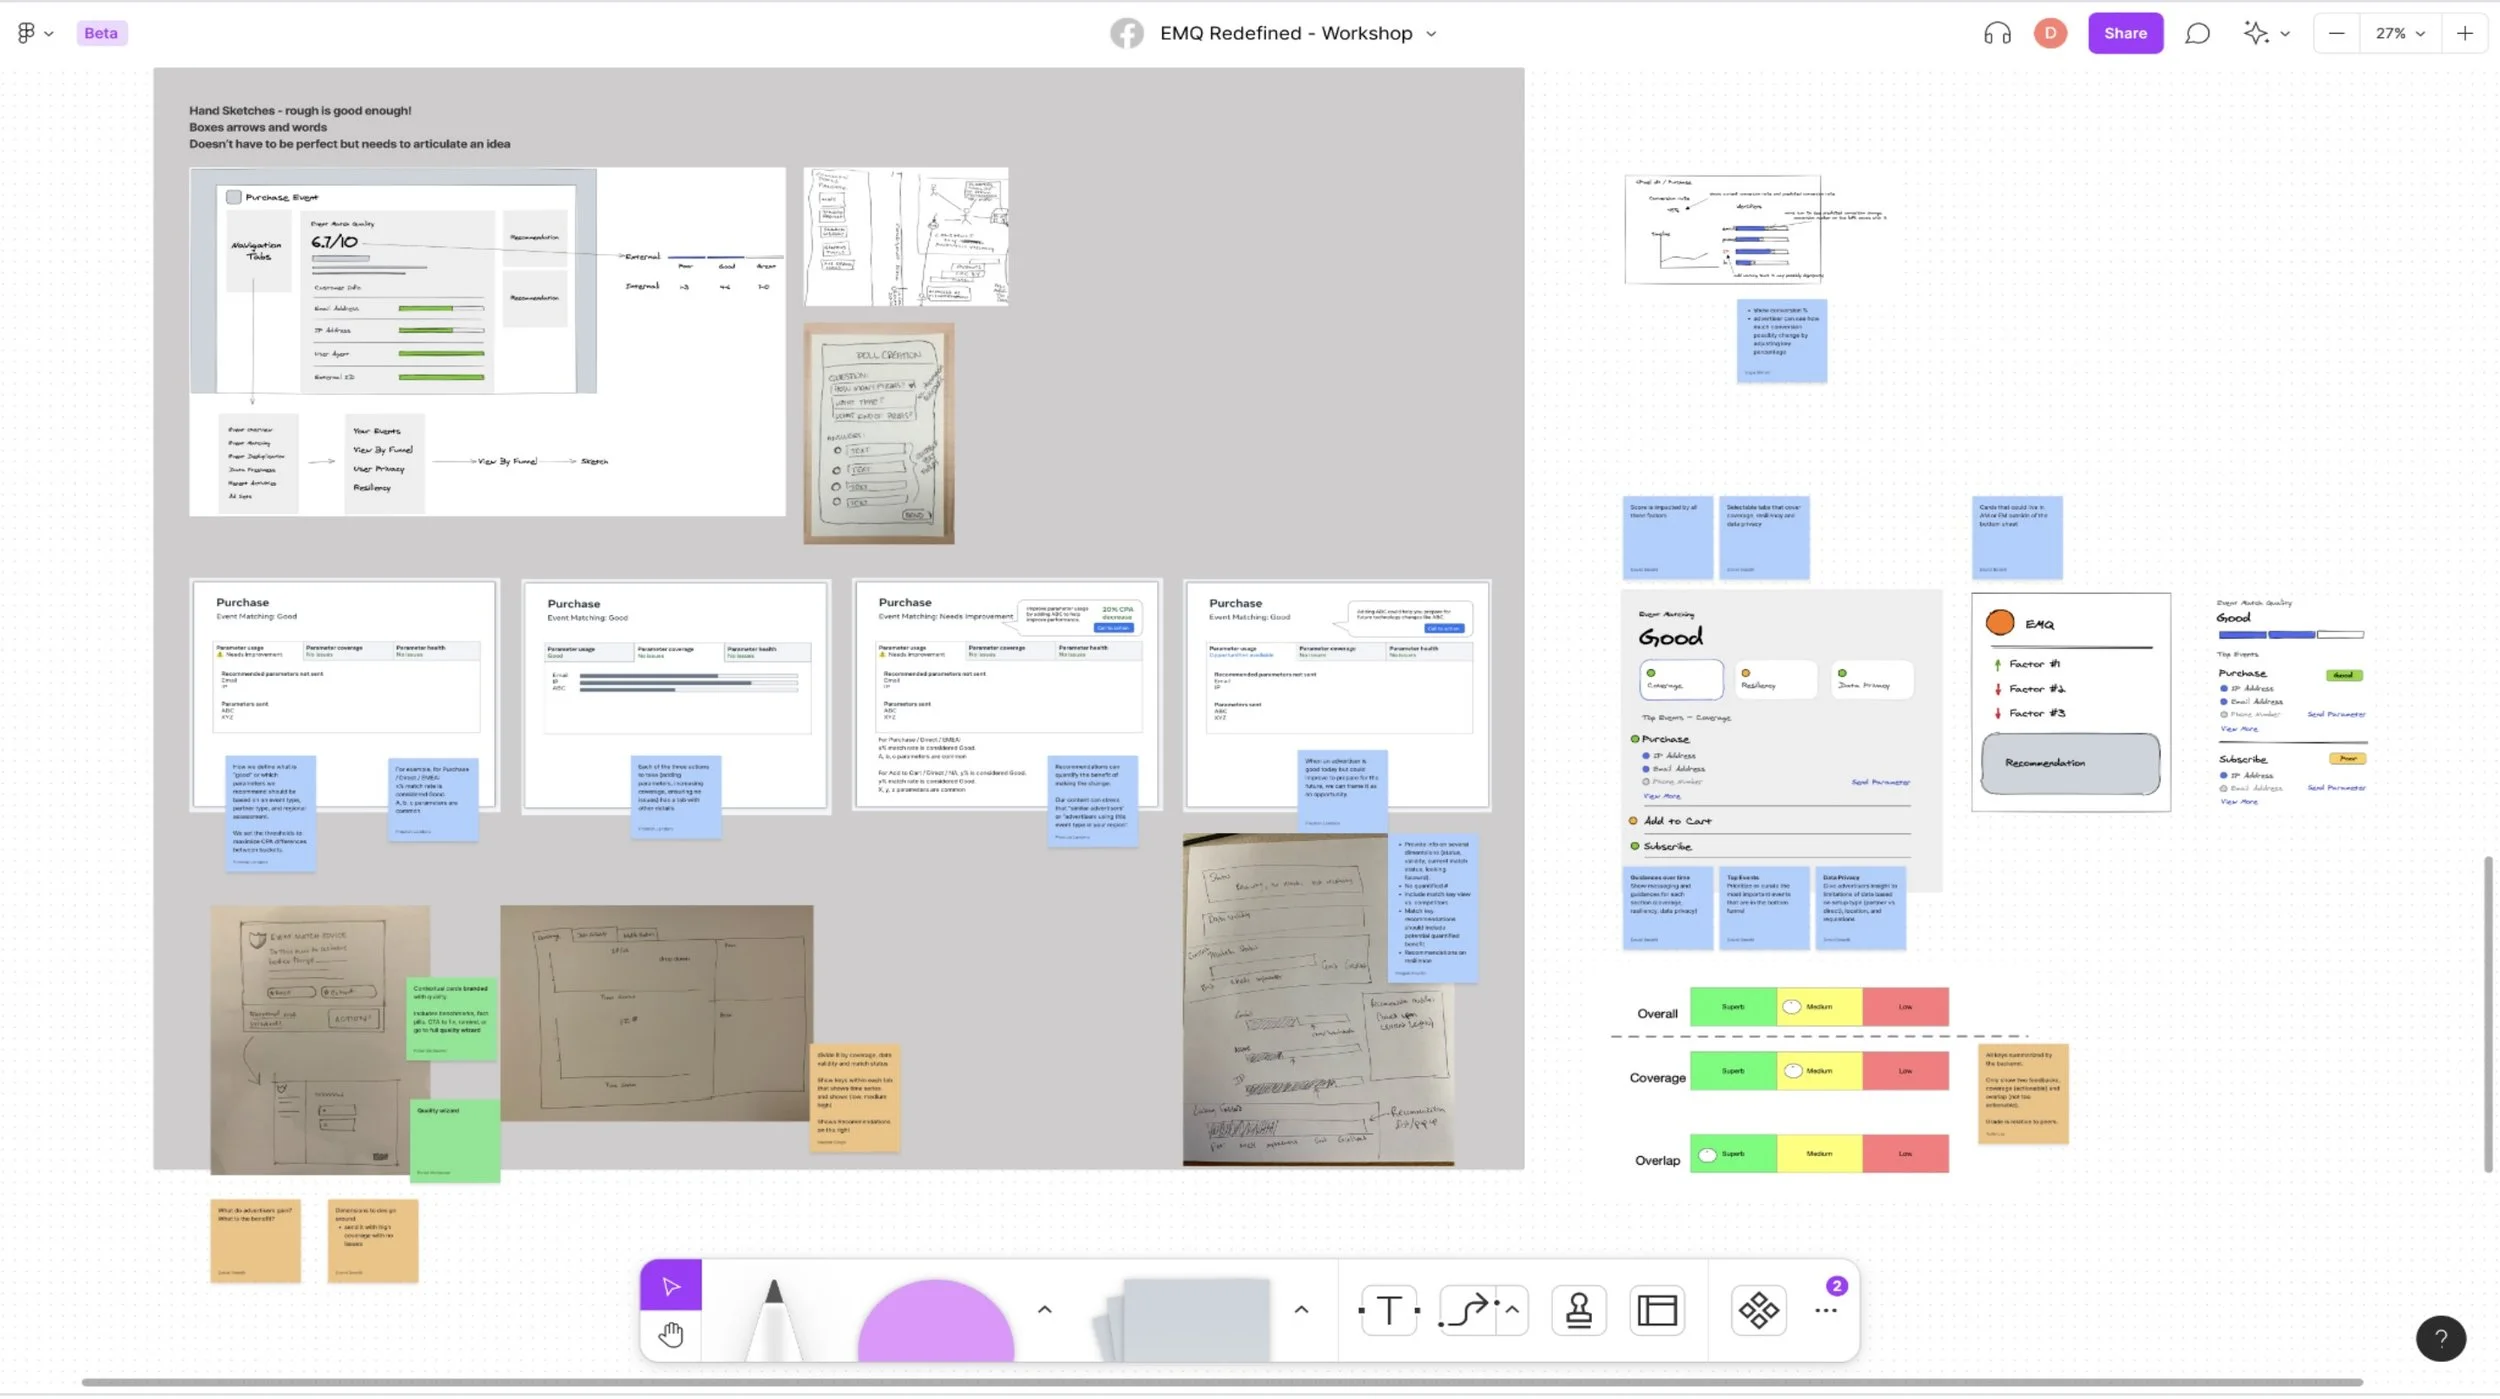
Brainstorming with Design & Product
In co-creation workshops, we used mind mapping and sketching to generate ideas. We then prioritized based on user value, feasibility, and business fit.
Three directions became clear:
Visibility
Introduce EMQ in onboarding and add a dedicated entry point in Event Manager
Comprehension
Qualitative rating based on a percentile (p) for advertisers' region and event type
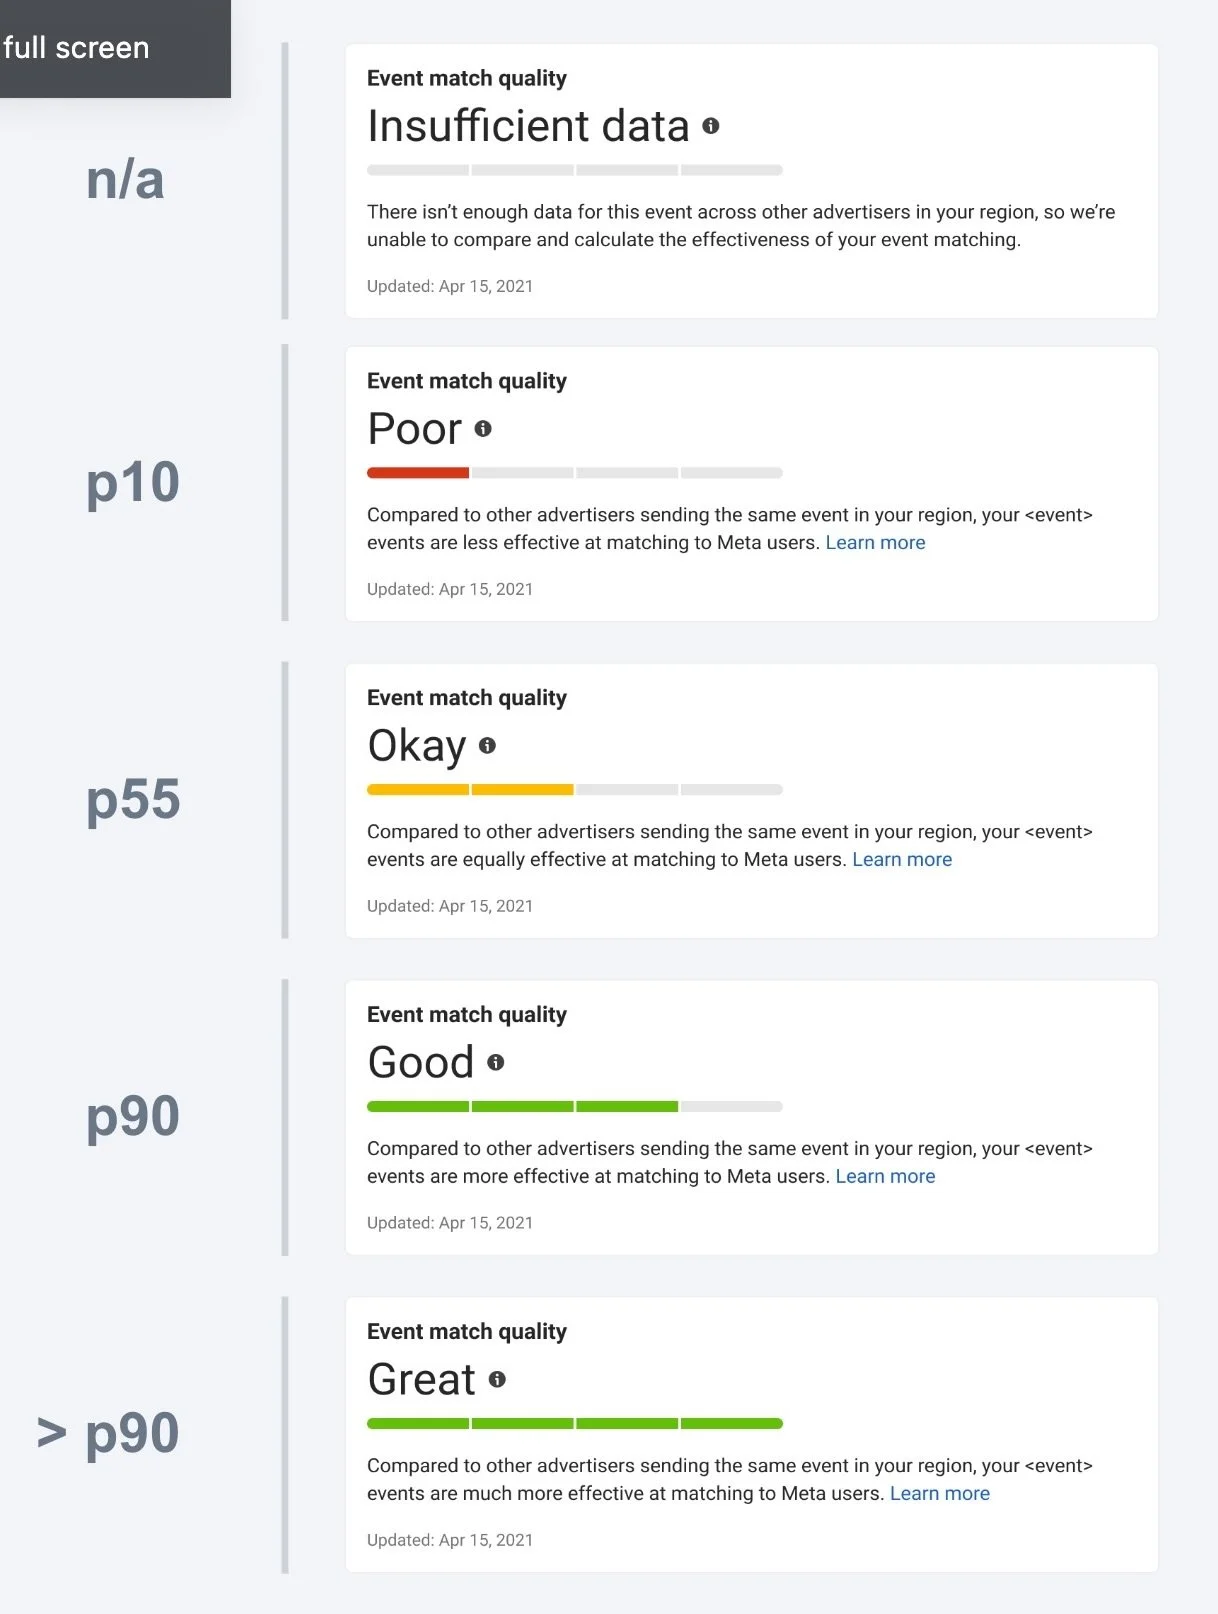
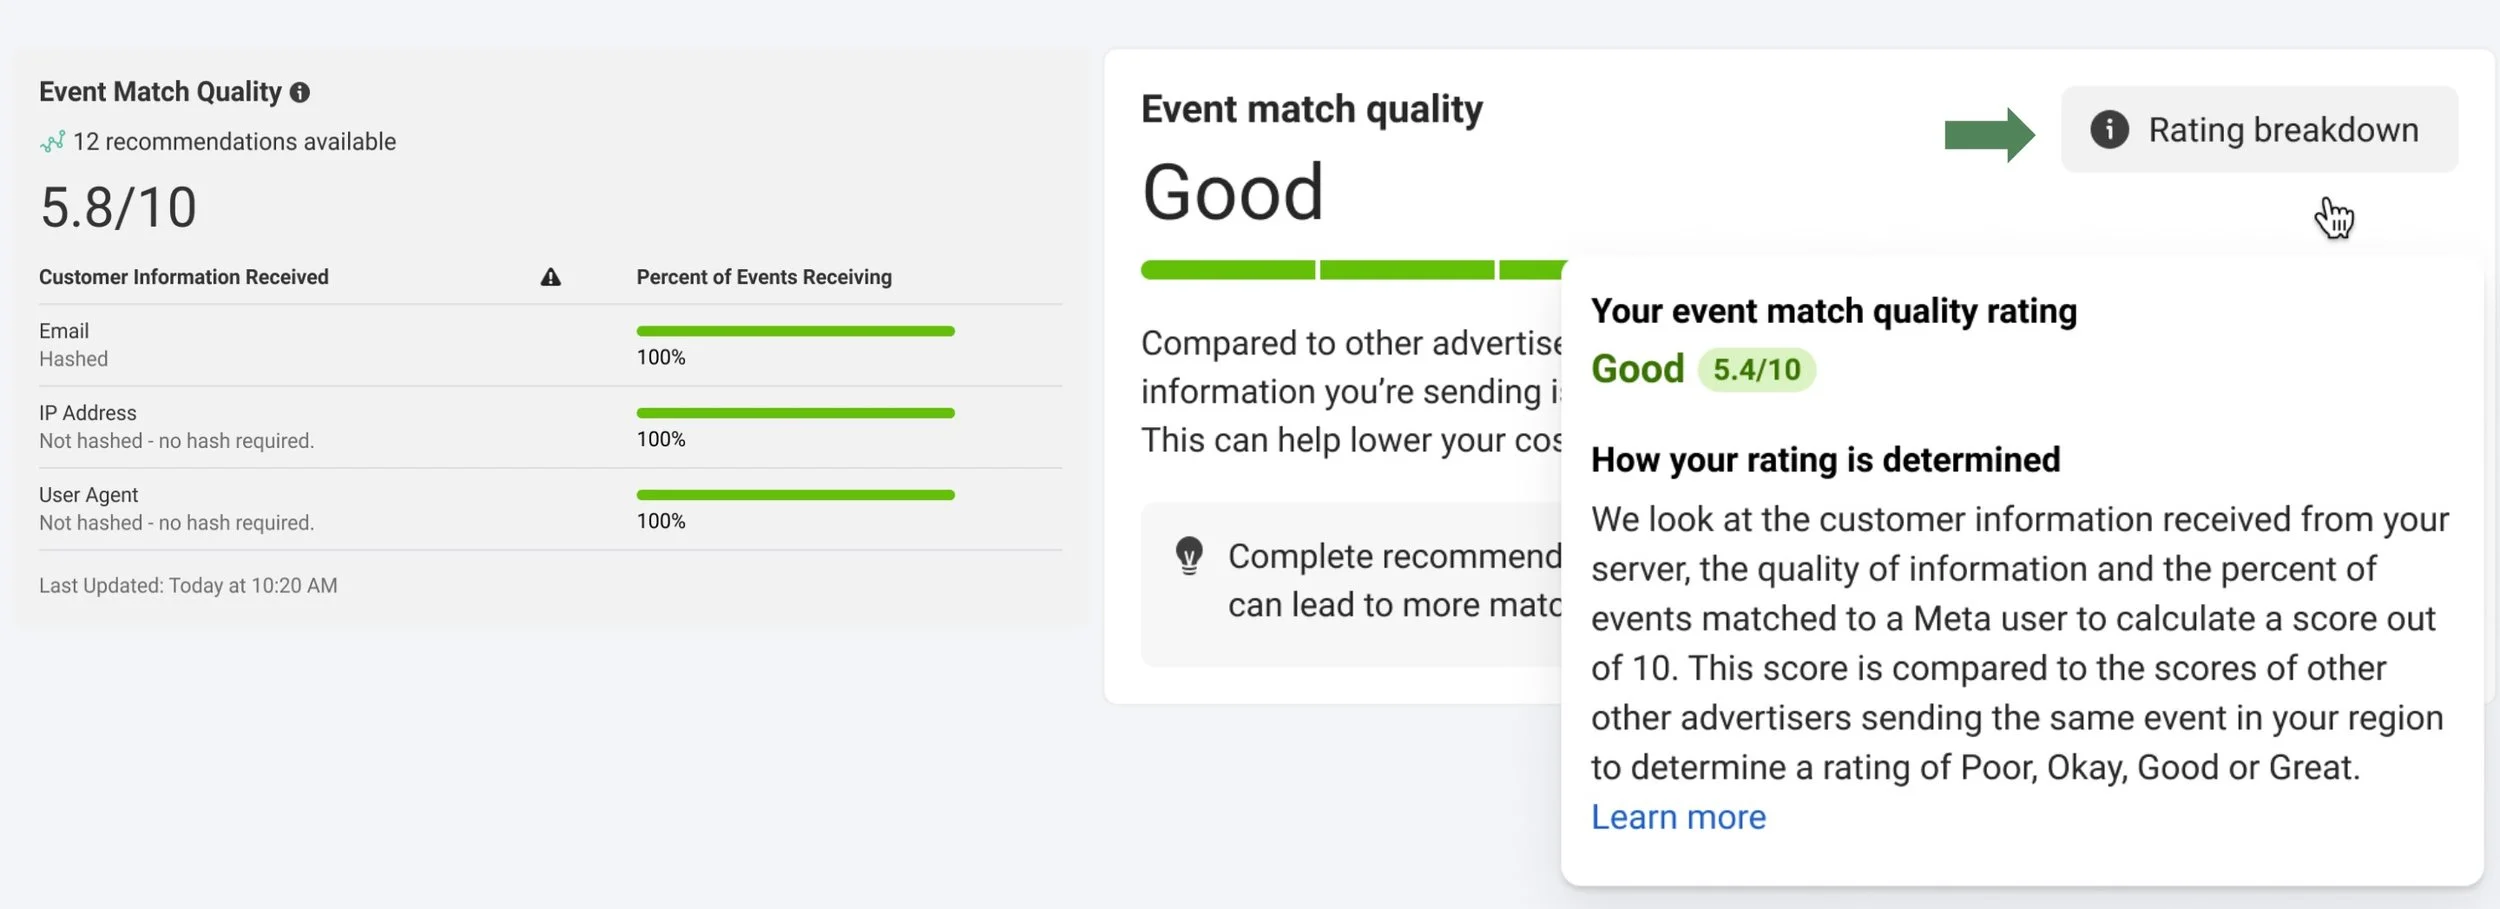
Revealing a score from 1-10 as a qualitative score when hovered over, clarifying minor changes and how the score is determined
Value Proposition
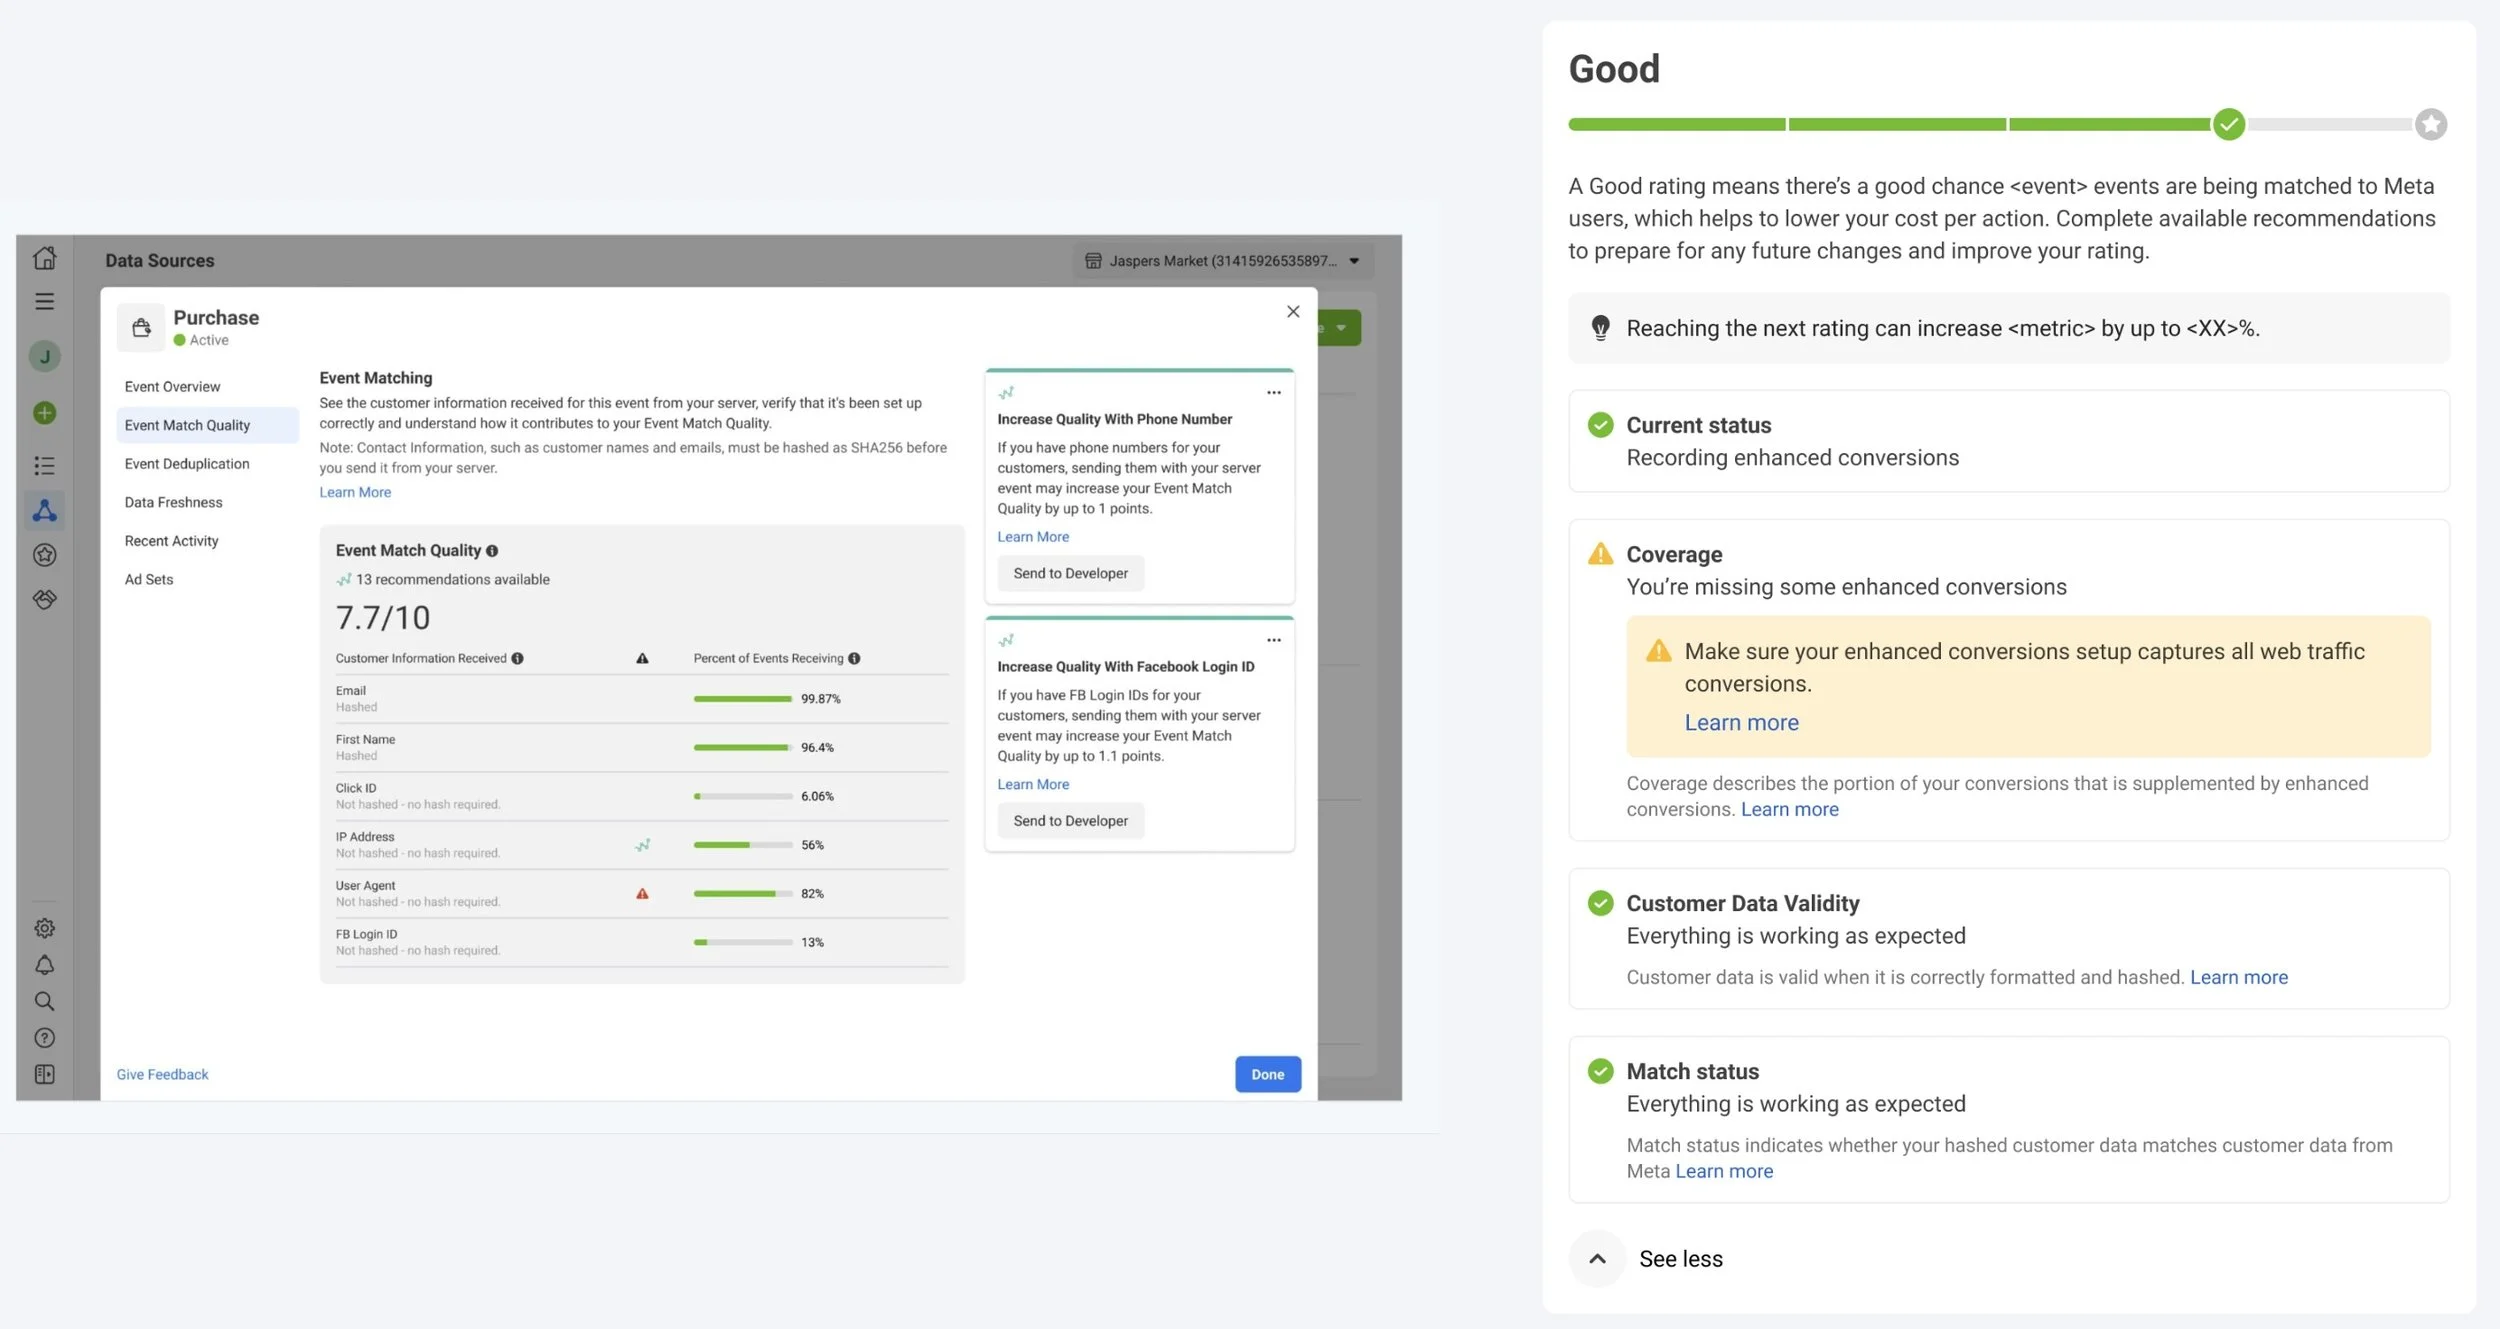
Frame EMQ improvements in terms of ROI, with diagnostic cards showing exactly what to fix
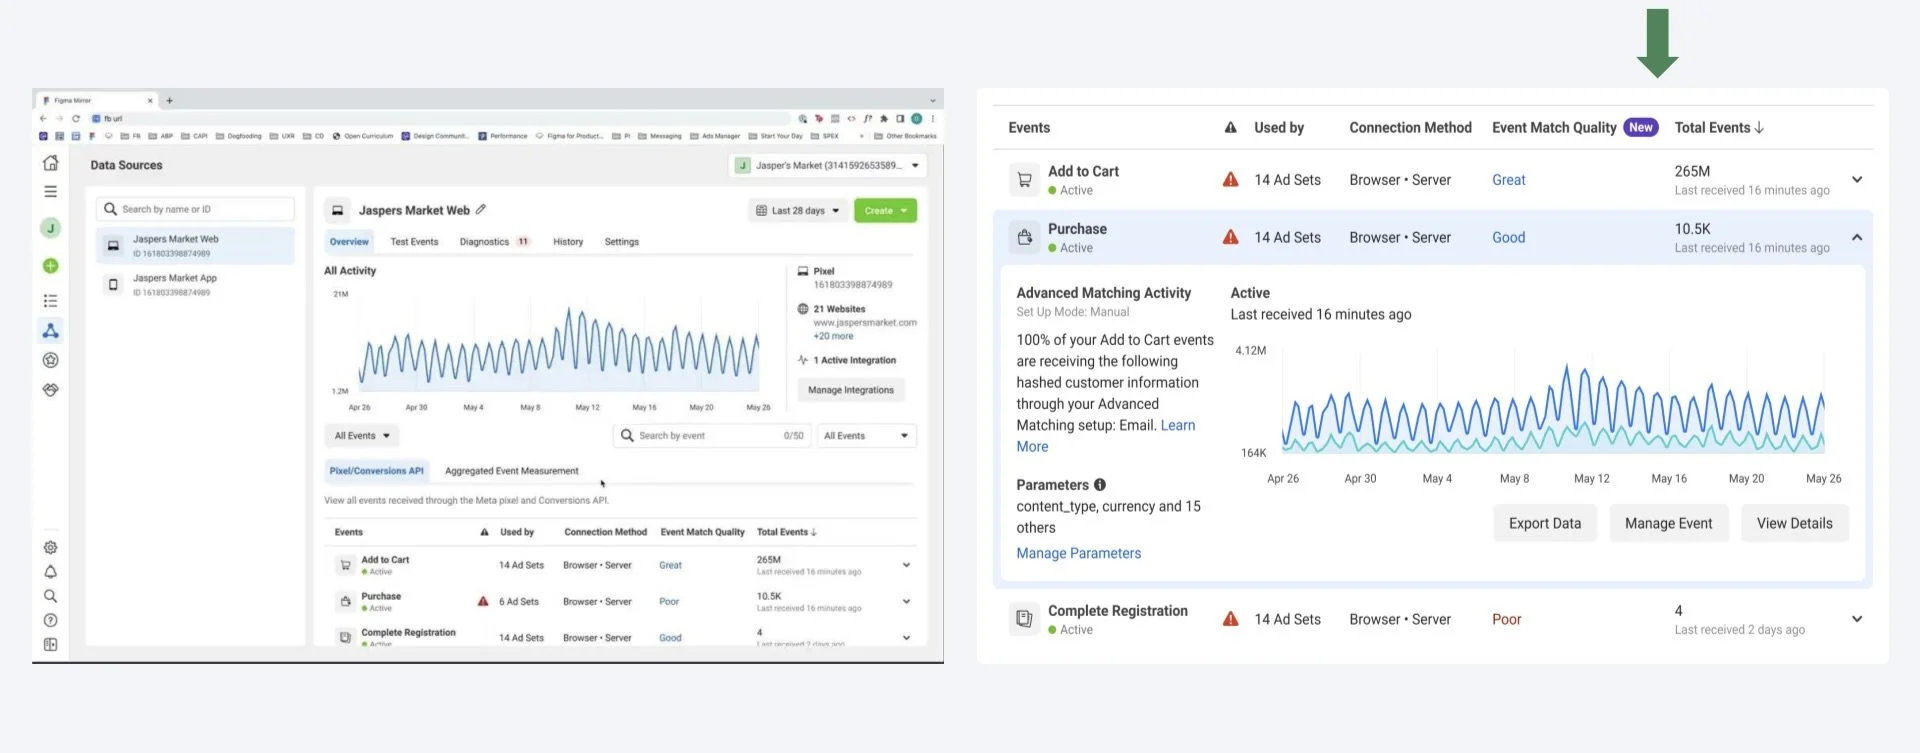
Testing Whether Our Fixes Worked
We validated the redesign through multiple methods:
Website Analytics → Tracked engagement with EMQ (clicks, hovers, completion rates).
Heatmaps → Visual evidence of increased attention to EMQ.
Surveys → Compared comprehension, confidence, and ease of setup before vs. after changes.
What Changed for Advertisers & for Meta Ads Manager KPIs
User Experience
+20% comprehension of EMQ meaning
+30% confidence in applying EMQ
+25% increase in perceived ease of setup
Engagement
+50% increase in EMQ interactions
-20% faster setup time
+30% more setups completed
-40% fewer setup dropouts
Business Outcomes
-15% Cost Per Action (CPA)
+20% conversion rates
+10% ROI lift
Conclusion
Key Insights
Advertisers cannot act on a feature they cannot find, do not understand, or do not trust.
Design Enhancements
By making EMQ visible, comprehensible, and valuable, we transformed it from an overlooked number into a trusted optimization lever.
Outcomes
For advertisers: clarity, confidence, and efficiency.
For Meta: higher engagement, reduced churn, measurable revenue impact.
Limitations
Small sample size (N=9), limiting generalizability.
Remote testing may have introduced distractions.
Scope focused on EMQ specifically, not the broader Event Manager experience.
Reflection
This project reinforced three lessons:
Cross-functional alignment. early on ensures research drives product and business outcomes.
Mixed-methods research (qualitative + quantitative) creates both depth and validation.
Framing UX insights in business terms secures stakeholder buy-in and investment.
Ultimately, this case study shows how rigorous usability research and user-centered design can turn an overlooked feature into a measurable driver of advertiser success and company growth.
A hidden number became a growth engine once research made it visible, comprehensible, and valuable.